

BLOG. 4 min read
Initially focused on core equity market indices’ performance replication, exchange-traded funds (ETFs) now span across investment strategies and asset classes. In the US alone, more than 400 new ETFs were launched in 2023 (see Figure 1). With an average of 77 ETF launches per quarter over the last 5 years, investors can choose among an ever-expanding fund offering. Praised for their low transaction costs and transparency, ETFs also provide high liquidity levels. It means ETF shares can, in general, be traded on an intra-day basis, with narrow bid-offer spreads. For financial regulators, the question of sustained liquidity is of prime importance as most ETF shares reach both institutional and retail investors.
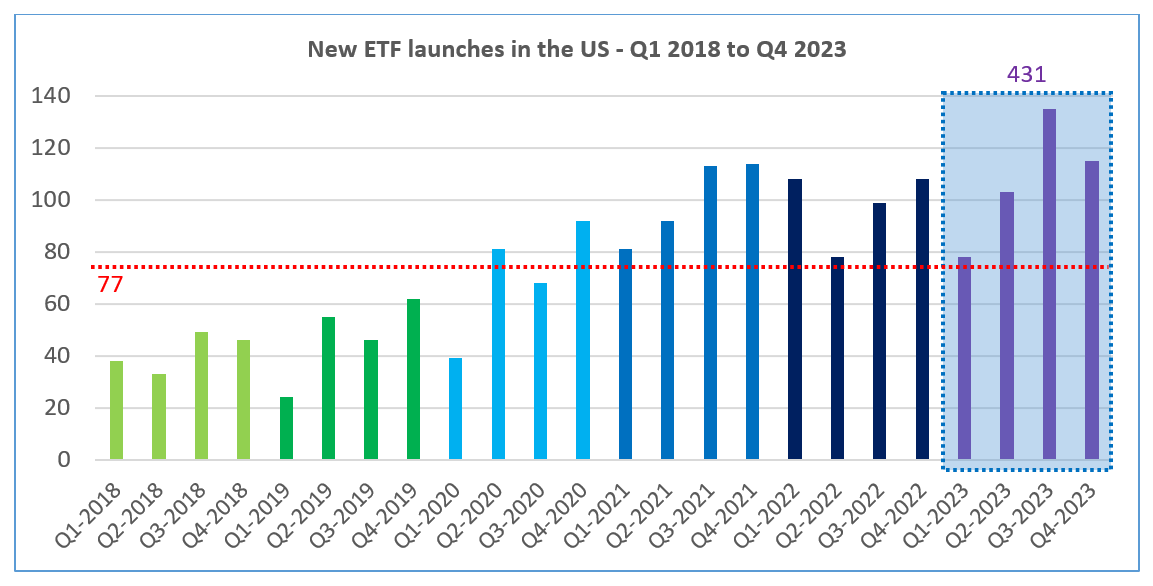
Fig. 1 – ETFs launched in the US across strategies and asset classes (Source: www.etf.com/etf-launches)
From regulators’ and fund managers’ viewpoints, liquidity management requirements cover two aspects: market liquidity and funding liquidity. Depending on jurisdictions, regional guidelines or rules in place may require the ongoing monitoring of market liquidity down to single position level. Evolving regulations also require fund managers—and/or their authorized participants (AP’s) on secondary markets—to handle redemptions with both exiting and remaining investors in mind. It means unlocking cash on time to cover short-term funding needs. It also implies keeping core market exposures as stable as possible despite expected out-flows.
Formal liquidity management processes have long been a “must-have” for fund management teams, including ETF managers. For some investment teams, the initial integration of market liquidity insights might take the form of instrument-level scores. These daily feeds can be added to broader market risk dashboards. The convenience of this approach provides useful market liquidity ranks across a fund’s positions. It is a “tip of the iceberg” perspective though. These scores are somewhat static by nature and often reflect “normal market” condition assumptions. The same applies to multi-factor models. Their fundamental outcomes are often used to manage investment tilts on stock characteristics such as “value,” “growth” or “quality.” Liquidity-related factor exposures provide valuable insights for systematic investment strategy deployment. Like liquidity ranking scores though, these instrument-level exposures are not designed to capture interactions between tradeable volumes, liquidation time horizons and trading costs.
For risk managers looking after investment products such as active ETFs, the integration of stress test scenarios in the daily market risk monitoring process is already the norm. These scenario sets can reflect deterministic shocks, or market risk factor states not shown in historical data. They can also mirror historical return conditions observed in dislocated market situations (“market replays”). This scenario-based approach increasingly applies to market liquidity risk monitoring requirements, as encouraged by a growing number of regulators around the world.
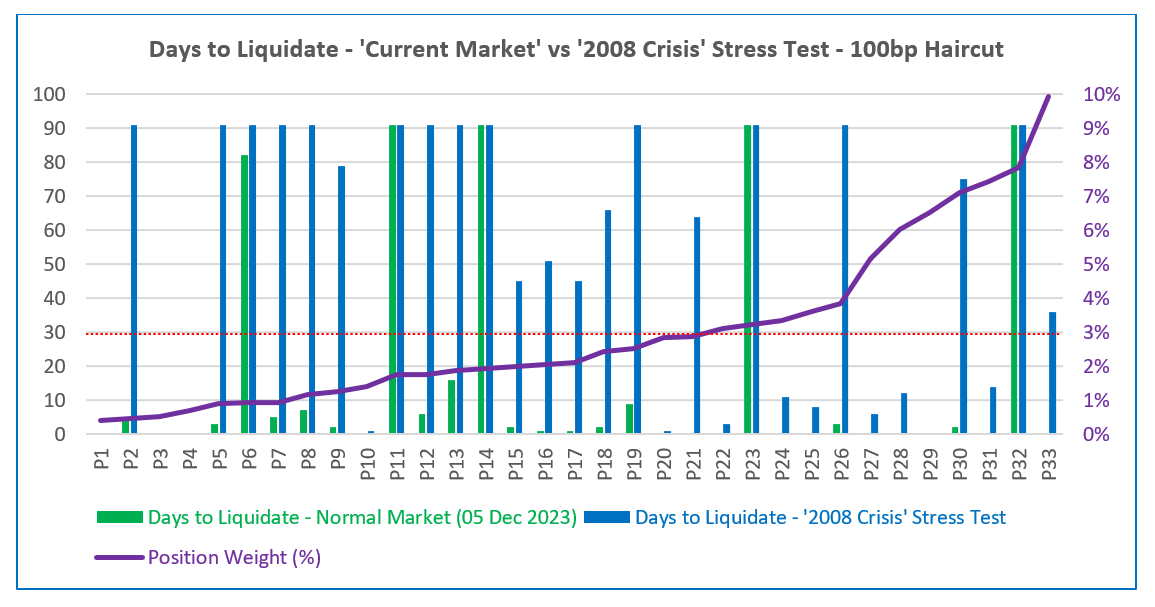
Fig. 2 – ‘Days to liquidate’ profile of a hypothetical ETF (active equity) portfolio in normal, and stressed market liquidity conditions.
Fund managers’ ability to liquidate some of their investment positions under normal market conditions and fixed haircut assumptions can vary significantly in stressed market situations. As illustrated in the chart above (see Figure 2), under “normal market” conditions and 1% trading cost assumptions, managers of the hypothetical active ETF can liquidate all but five equity positions in no more than 30 days. Leveraging ICE LST “2008 Crisis” data points and SS&C Algorithmics-derived market liquidity surfaces, the projected liquidation horizons change a lot in these simulated conditions. Under a “2008 Crisis” scenario and unchanged haircut levels of 100 bp, 21 positions cannot be fully liquidated within the 30-day horizon.
Another visualization example of the portfolio’s market liquidity profile is represented below (see Figure 3). More than half of the portfolio can be sold on the same day in normal market conditions and 1% haircut. Assuming the same constant trading cost, it takes 14 days to reach that 50% liquidation threshold under the “2008 Crisis” replay.
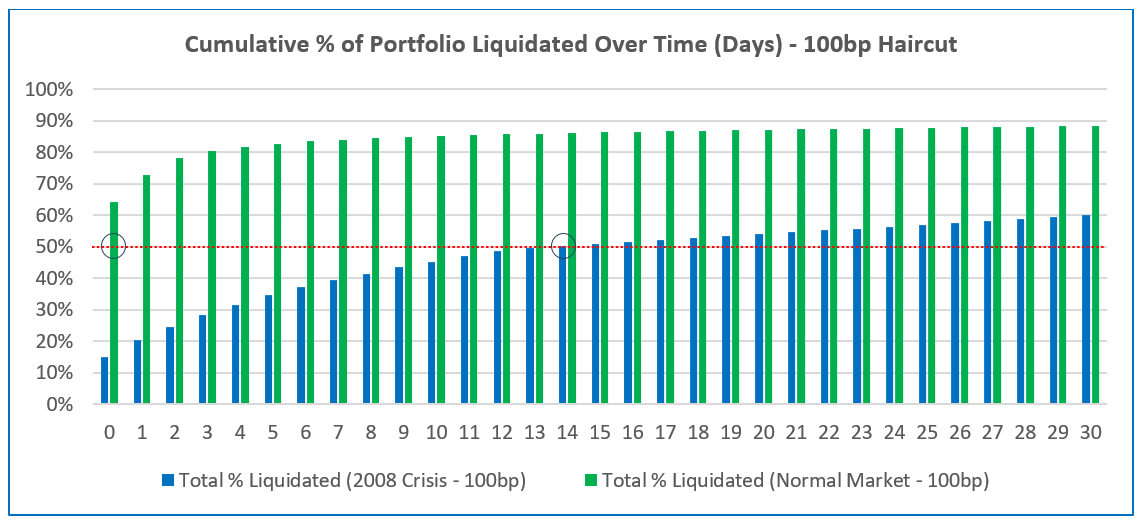
Fig. 3 – Cumulative % of portfolio liquidated in normal, and stressed market liquidity conditions.
While fund managers develop a good intuition for market liquidity levels in their investment universe, the quantification of liquidation time horizons and marginal trading costs under stressed scenarios is not an easy task. The wider the investment universe is, the less trivial the assessment and the more important a systematic process becomes. For fund managers and risk analysts of actively managed ETFs, the exploration of key portfolio indicators through an integrated risk management lens provides clear benefits. As shown in the example above, managers (and market-making APs) can gain actionable insights by comparing normal and stressed market liquidity simulation outcomes across their ETF positions. These liquidity risk insights shall be passed into market and credit risk management processes as well, for example in the form of revised exposure limits or portfolio optimization constraints.
For deeper insights, download our SS&C Algorithmics "Liquidity Stress Testing for Market Risk Management" research report on liquidity stress testing for market risk management.
Contact us to learn how you can use SS&C Algorithmics products in your risk management, portfolio construction and reporting processes.


.jpg)