
BLOG. 4 min read
Segmentation has long been a key piece of classifying financial advisors and determining the treatment and coverage of a firm’s existing and potential clients. In recent years, approaches to segmentation have become much more nuanced due to the increased availability and functionality of data, as well as the widened scope of advisor operations and sophistication. This was accelerated by the COVID-19 lockdown when sales teams had to make higher use of data in order to gain insights into advisor behavior during a time when they couldn’t interact in person.
The approach to segmentation varies widely across asset management firms. On the simpler side of the spectrum, advisors can be segmented by the size of their book of business, with large advisors being classified as a higher priority; a channelized overlay may also be used here. Moving to the more complex end of the spectrum, firms can use a multitude of factors to arrive at a score for each advisor that determines their segment and, in turn, their priority to the firm. The underlying factors that can be used are practically endless; to name a few areas under which there are many data points:
- Sales
- Assets
- Market Share
- Vehicle Use
- Distributor
- Redemptions/Net Sales
- Model Usage
- Frequency of trading
- Momentum
The output of a segmentation model is ideally a collectively exhaustive mapping of all covered and uncovered advisors to a segment that determines how that advisor is viewed and treated by the firm. What is not defined is how to interact with the advisor after you have determined their potential or current value to your firm.
Let’s take an example of two advisors who are both classified as high-priority by a firm—they may be called Tier 1, Platinum, A, Primary, etc.—the name choices are endless! These advisors both have a sizeable book with growing sales, they have discretion over portfolio investment decisions, and the firm’s products are available on the advisor’s platforms. One advisor prefers regular monthly meetings with a wholesaler to get updates on product performance and strategy, ask questions, hear about value-add offerings, etc. They also want to occasionally speak with a portfolio specialist. The second advisor prefers to meet several times a year with a product specialist to have in-depth conversations about product strategies and characteristics, how they fit into their client’s portfolios, and the product team’s outlook on the market. They prioritize having access to a firm’s product specialists and call on them often to ask specific questions on portfolio design. They don’t really want to meet with a wholesaler aside from a quick virtual check-in if/when needed.
Through repetition and experience, wholesalers have traditionally worked to determine how to interact with each advisor in their territory. This process of determining the interaction preferences of advisors is a labor-intensive and inefficient process. Not to mention the dependence on all this knowledge being documented properly in the firm’s CRM for use when coverage changes for any reason (wholesaler leaves; advisor changes firms; advisor is assigned to another sales team member). Some might argue that this is precisely the job of a wholesaler and that is not entirely untrue; however, greater visibility into an advisor’s interactions would be immensely helpful in this process.
SS&C’s Distribution Solutions team is working to help solve this problem. We are actively putting together an activity consortium to aggregate and track all active touchpoints with an advisor. We are receiving CRM data from clients with activity types/codes. We are sorting through the data and removing any passive, non-qualifying activity types. Qualifying activity types are those actions directed by a wholesaler that can directly influence a financial advisor’s investment decisions.
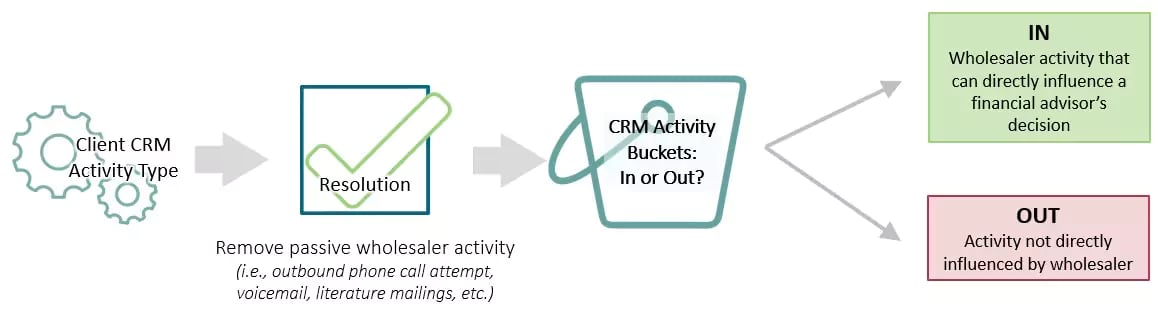
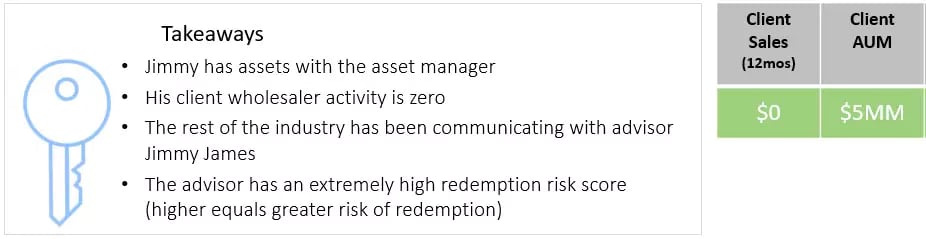
Once this data is collected, cleaned, and aggregated, we are creating an “activity profile” for each advisor, as well as each asset manager’s “market share” of activity. In the fictional example below, Jimmy James from Next Financial Group has had 745 qualifying interactions with asset management sales teams in the past 12 months. The specific asset manager for whom we are showcasing Jimmy has had no interactions with him and no sales in the past year. The “Advisor Meeting Willingness Score” is quite high (90 out of 100) because of their level of activity with other asset managers, as compared to other advisors in the data set, but so is their Advisor Redemption Risk Score (100 out of 100).
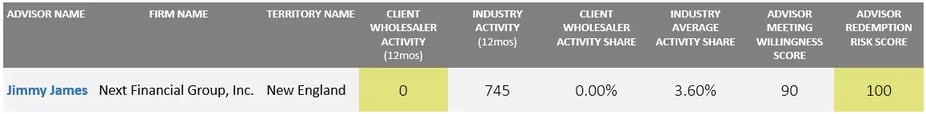
* All figures are fictional and for example purposes only
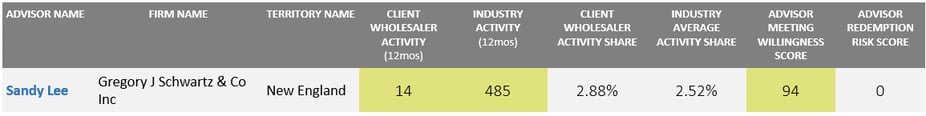
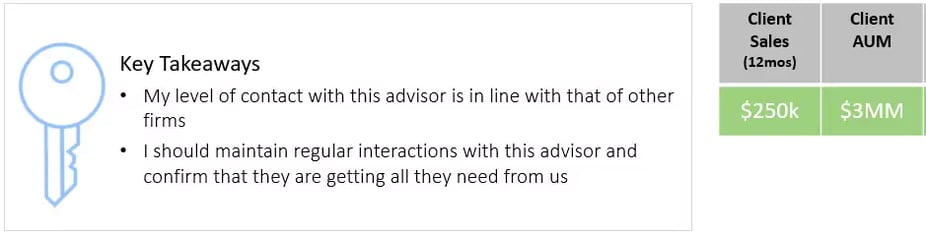
Another fictional example is Sandy Lee, with whom the submitting firm has had 14 qualifying interactions in the past 12 months, in line with what other firms are doing (2.88% of activity, just above the average firm’s share of activity with Sandy). They have done $250k of business in the past year and seem to be building up their AUM.
The use cases for this data are considerable; the level of insight added by knowing the activity levels of advisors provides valuable context for managing existing advisor relationships, growing new relationships, and prospecting.
Contact our SS&C Distribution Solutions team for more information about this new consortium and details on how you can participate.