
%20(1).jpg)
BLOG. 4 min read
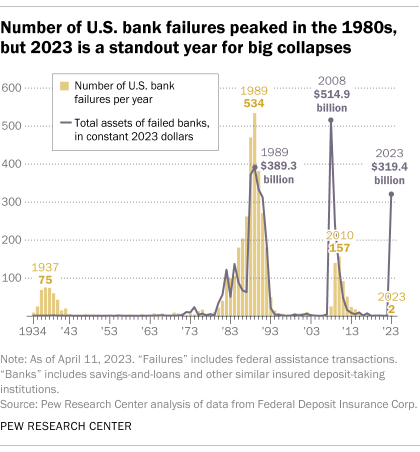
The vast majority of commercial banks, not bank offices but individual banking organizations, that have ever operated in the U.S. have disappeared. Since an all-time high of 30,456 in 1921, an unfathomable number, the bank population declined to a mere 4,377 by the end of 2020, down 86%. The local/community nature of banking plus years of banking regulations that precluded regional or national bank expansion, drove the excessive number of banks.
The decline in this number has been the result of bank failures and banks combining due to near or actual failure. These bank failures have come in three waves; Great Depression (c1929-41), S&L Crisis (early 1980s–c1991), and Great Recession (2008-2009). Noteworthy are the bank panics in 1819, 1837, 1857, 1873, 1884, 1893, and 1907. Today, the five largest U.S. banks hold approximately 46% of US banking assets, about the same as before the 2008 crisis.
 [1]
[1]
When examining the U.S. banking industry from 1984 to 2003, two important, interrelated issues emerge—banking industry consolidation and profitability. This period spans the end of the S&L Crisis and the years leading to the 2008 Great Recession. What we see is the number of banks decreased by half and the decrease came predominantly from the failure or merger of small banks (see chart below).
The policy at the time was reflected in the governmental entity tasked with addressing the problem, the Resolution Trust Corporation. To oversimplify, the process was to either close banks or combine them. When that crisis was settled, the RTC was abolished in 1991. (The very different policy implemented for the next crisis, 2008-09 is reflected in its name, Troubled Asset Relief Program, or TARP.)
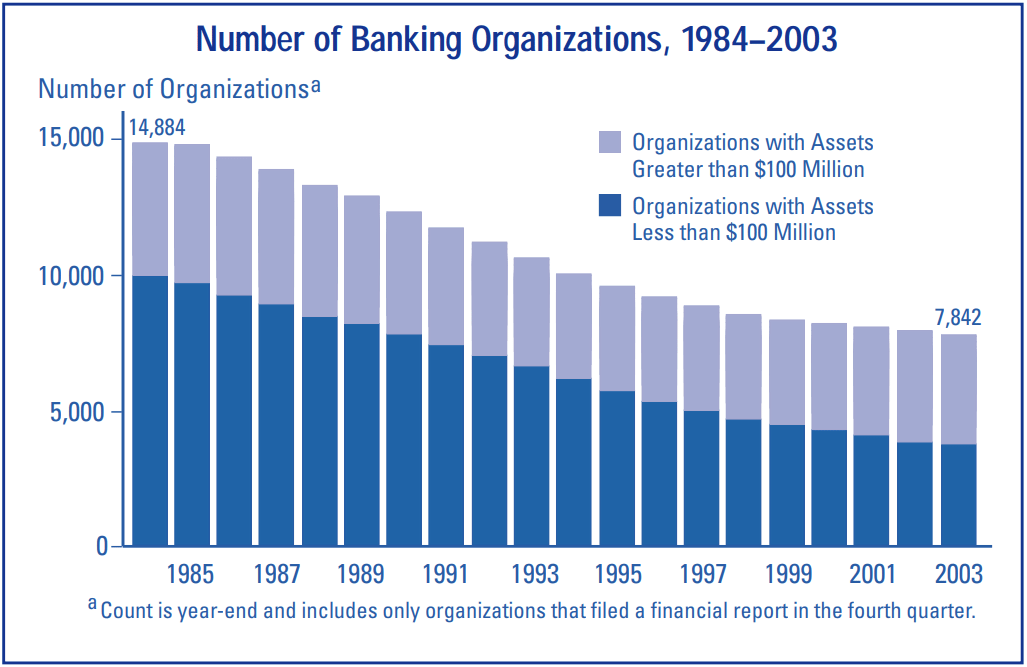
What occurred in 1984-2003 was rapid banking consolidation with small banks getting big and big banks becoming too big to fail. As you’ll see in the above chart[2], in 1984 large banks held 42% of banking assets, and by 2003 that grew to 73%. Even more striking: the five largest U.S. banks held 17% of banking assets, which increased to just over 40% by 2004. Today the figure is 43%. This was a period of great industry consolidation in the U.S.
What was happening as banks were consolidating? A clear shift in how banks generated their profits.
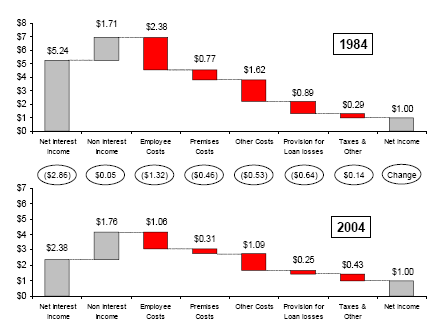
To understand the above chart[3], it is helpful to start at the end. It depicts how U.S. banks earned $1 of net income over the period 1984–2004 (right-most bars). In other words, it normalizes banks’ revenues and costs/expenses to end with $1.00 of profit. In 1984, banks started with net interest income (NII) of $5.24 and non-interest income of $1.71 to reach $1.00 in profit. Importantly, along the way $2.38 of employee costs and $0.89 of provisions for loan loss were taken. (Third and sixth columns from the left). Twenty years later, only $2.38 of “old school” NII and $1.76 of “new school” non-interest income were needed. Further, employee costs were shredded to $1.06 and loan loss provisions were cut back to $0.25.
Just these latter four figures tell an important story. Over this twenty-year period when banks were getting bigger, the biggest banks moved away from loans as the dominant money maker, toward derivatives and other capital-light products to drive revenues. At the same time, technology allowed de-emphasis on brick-and-mortar networks in favor of online access. Finally, and crucially, banks underfunded their loan loss reserves significantly. The result is that when the banking crisis of 2008 hit, banks were ill-prepared to absorb the losses at exactly the critical time.
Post-2008 crisis, new regulations put pressure on banks to build back their financial positions. The Dodd-Frank Act of 2010 and Basel III capital standards significantly increased the quantity and quality of capital expected to be held by banks. New stress tests now anticipate whether capital will be sufficient during difficult, adverse scenarios. Rules are being finalized in the U.S. for additional capital charges for Systemically Important Financial Institutions (SIFIs). Lastly, as Dodd-Frank requires, the largest banks have already submitted plans (“living wills”) describing how they may be resolved should that be necessary.
The U.S. government's response to the bank failures in Q1 2023 was swift and bold. The banking system was not dented. However, risks remain.
CPE Course Library | Are you curious to learn more? Check out the GAMMA Library including over 300 hours of approved industry CPE courses and related timely articles. Click here to explore the full course listing, available CPE credits and registration for the GAMMA Library.
About Us | The SS&C Learning Institute is a division of SS&C dedicated to providing continuing education for today’s professionals. From a library of 250+ online CPE courses to microlearning articles and videos, our offerings are delivered by industry-leading subject matter experts and cover a wide variety of financial markets topics. To learn more about the SS&C Learning Institute, please visit ssctech.com/learn.
Monthly Newsletter | Subscribe to news from the SS&C Learning Institute to gain continued access to expert insights on the latest industry topics.
[1] https://www.pewresearch.org/short-reads/2023/04/11/most-u-s-bank-failures-have-come-in-a-few-big-waves/
[2] Source: FDIC
[3] Source: FDIC
%20(1).jpg)
.jpg)
%20(1).jpg)